 AFM Studio
Field Atlas
 Field Atlas
A map of how math, physics and biology branched into their fields, every turning point sourced
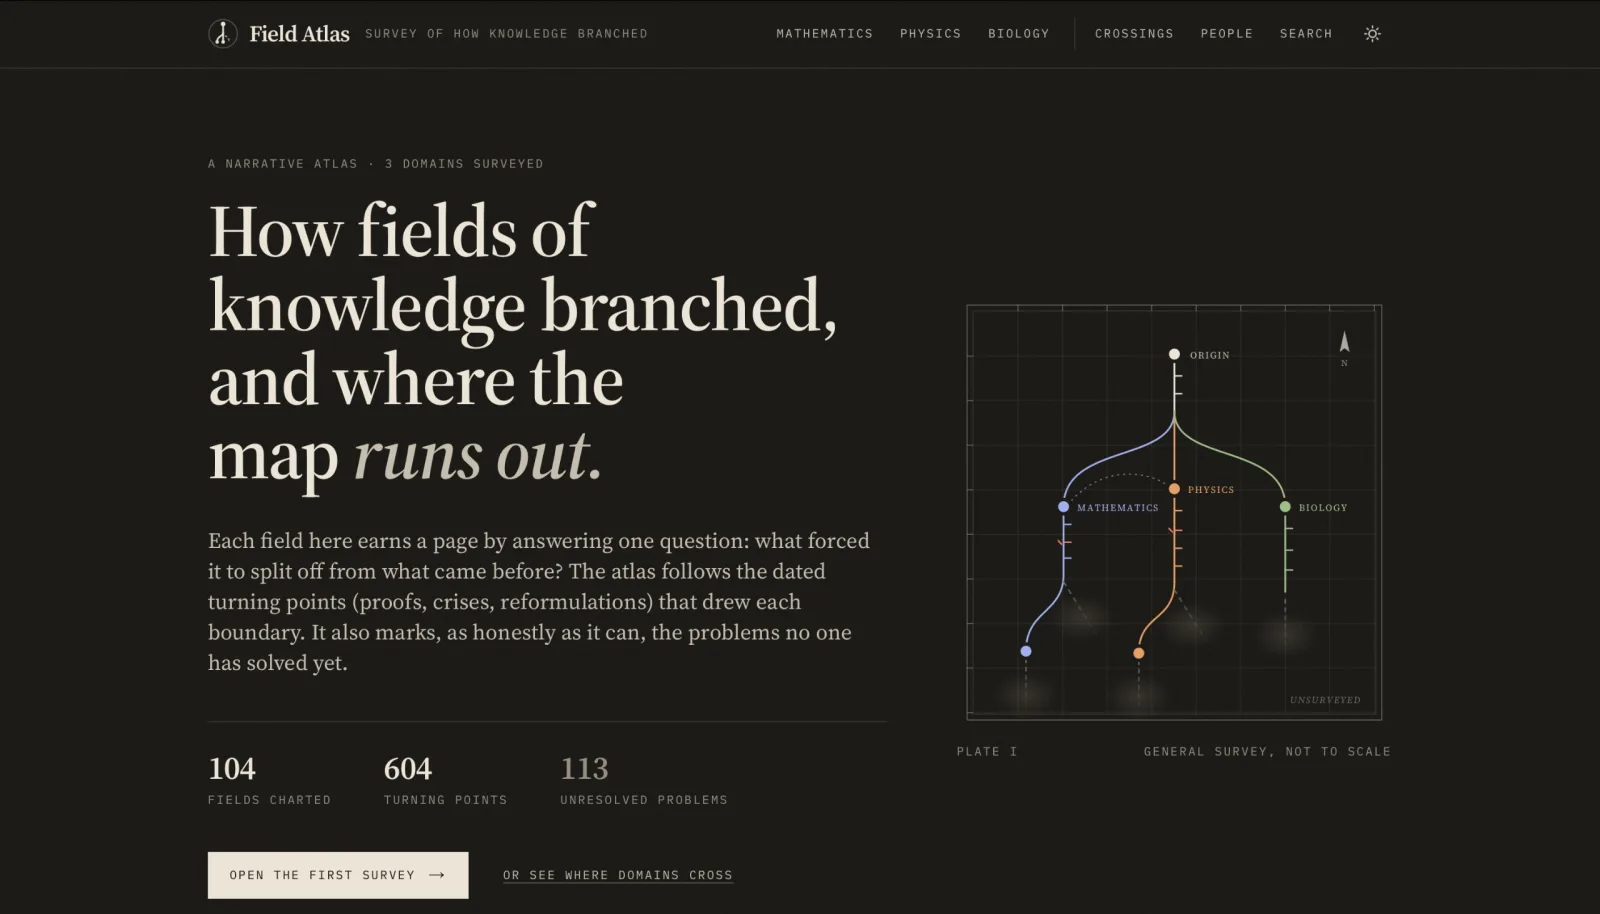
- fields documented across math, physics and biology
- 104
- turning points, each with a cited source
- 604
- open problems tracked across all fields
- 121
- historical figures indexed by field
- 805
On this page
- The problem
- What I built
- I store every fact as a version-controlled file, with no database or backend
- The build itself enforces correctness instead of a test suite
- I wrote the field-tree's layout by hand instead of reaching for a graph library
- Every data type shares one collection instead of one table per domain
- A field's influence is a property of the lineage graph itself
- Result
- Under the hood
The problem
A field of study usually arrives to a reader as a settled body of facts. Riemannian geometry, say, shows up in a textbook with no sense of where it came from, what question it was originally answering, or what it connects to elsewhere. That context exists, scattered across Wikipedia history sections, textbook prefaces and biographies, but nothing shows the branching structure across a whole domain at once.
I built Field Atlas for curious readers without a specialist background: students, career-changers, anyone who wants a field's origin story and its shape. It has no accounts, no comments and no ranking of "best" fields. Every fact needs a source. Every correction has to be a single-file edit, which pushes the work of keeping the data correct onto the build itself.
What I built
I store every fact as a version-controlled file, with no database or backend
Content lives as Markdown and JSON files in the repository, so a correction is a pull request; nothing here goes through an admin panel. It's the same model I use across my other static reference sites. The whole thing builds to static HTML with no server to run and no accounts to secure. Hosting is free on GitHub Pages.
The build itself enforces correctness instead of a test suite
With no admin panel, a typo in a parent reference or a missing citation would otherwise only show up as a broken page after it deployed. The build fails on an unknown parent, a cycle in the field graph, or a duplicate turning-point id. It also fails on a turning-point type outside its domain's vocabulary, a contested point with no note explaining the dispute, or any reference that doesn't resolve. A broken commit can't reach production.
I wrote the field-tree's layout by hand instead of reaching for a graph library
A field can grow out of two parents at once, born at the seam between them, so a plain linear timeline wasn't enough. The graphs themselves stay small, a handful to a few dozen nodes per thread, which is too small to justify a general-purpose graph-layout dependency. The layout computes each field's layer by its longest path, scores every candidate left-to-right ordering by how much it makes branches cross through another field's dot or label, and refines the best few by sliding nodes sideways.
Every data type shares one collection instead of one table per domain
Fields, turning points, open problems and figures each live in a single collection filtered by domain, not three parallel copies for math, physics and biology. That's what let the cross-domain crossings view arrive as a filter over data that already existed, without rewriting the content model underneath it.
A field's influence is a property of the lineage graph itself
The project rules out a ranking layer by design, but readers still want a sense of which fields' ideas traveled furthest. The toolkit page answers that by counting how many threads a field reaches directly, then its direct links, then everything downstream of it. It's a search over the same successor graph and cross-domain applications the rest of the site already computes. The ranking is a proxy over sourced facts, not a separate opinion layered on top.
Result
Field Atlas is live. It documents 104 fields across math, physics and biology, with 604 sourced turning points, 121 tracked open problems, and 805 historical figures indexed across them. I built it solo over five days in September 2026, writing every field's chapters, turning points and open problems myself, then wiring the cross-domain and ranking views on top of that same data.
Under the hoodTechnical detail for engineers
- Next.js 14.2.35, static export (
next build→out/); no server runtime in production. gray-matterparses YAML frontmatter and Markdown per field file;react-markdownwithremark-gfmrenders prose tables, lists and code blocks;remark-mathandrehype-katex(KaTeX 0.16.47) render inline and display math, with the rootkatexpackage kept only for its stylesheet, pinned to the versionrehype-katexrenders with.src/lib/content.tsruns at build time and rejects unknown parent ids, cross-domain parent links, cycles (found by depth-first search with trail tracking), duplicate turning-point ids across domains, turning-point types outside a domain's vocabulary, contested points missing their required note, and unresolved figure references.src/lib/treeLayout.tsis a manual layered DAG layout: longest-path layering, row-overflow handling for rows of more than three fields, an ordering search scored by branch-through-dot cost, then label cost, then crossings, then barycenter distance, refined by local sliding.src/components/FieldTree.tsxdraws the result as SVG usingd3-shapefor branch curves, animated in with apathLengthdash, with unresolved open problems drawn as fading dashes.- Lineage that crosses into another thread is drawn inside each node's own label column, not as separate stubs between rows; an earlier stub-based approach collided with converging branches.
- Social cards are drawn at build time by
src/lib/og.tsxvia Next's Satori-basednext/ogimage response, through a route whose slug carries.pngso the static export writes a real image file; card fonts are committed as TTFs because Satori can't read woff2. - Theme tokens are CSS variables for day and night, applied by a pre-paint script before first render; no component or SVG hard-codes a color.
- Deploys via GitHub Actions on push to
main: Node 22, install, lint, build, then publish throughactions/upload-pages-artifactandactions/deploy-pages, with the base path and site URL set byactions/configure-pages. - No database and no test framework anywhere in the project; a charting library considered early in planning was never added once the data didn't call for it.
- 268 commits over 5 days, September 23 to 27, 2026. 4,624 lines of TypeScript and TSX across 14 routes and 15 components.
Screenshots
Stack
Hiring, or building something similar?
I'm open to full-time roles and select freelance work.