 AFM Studio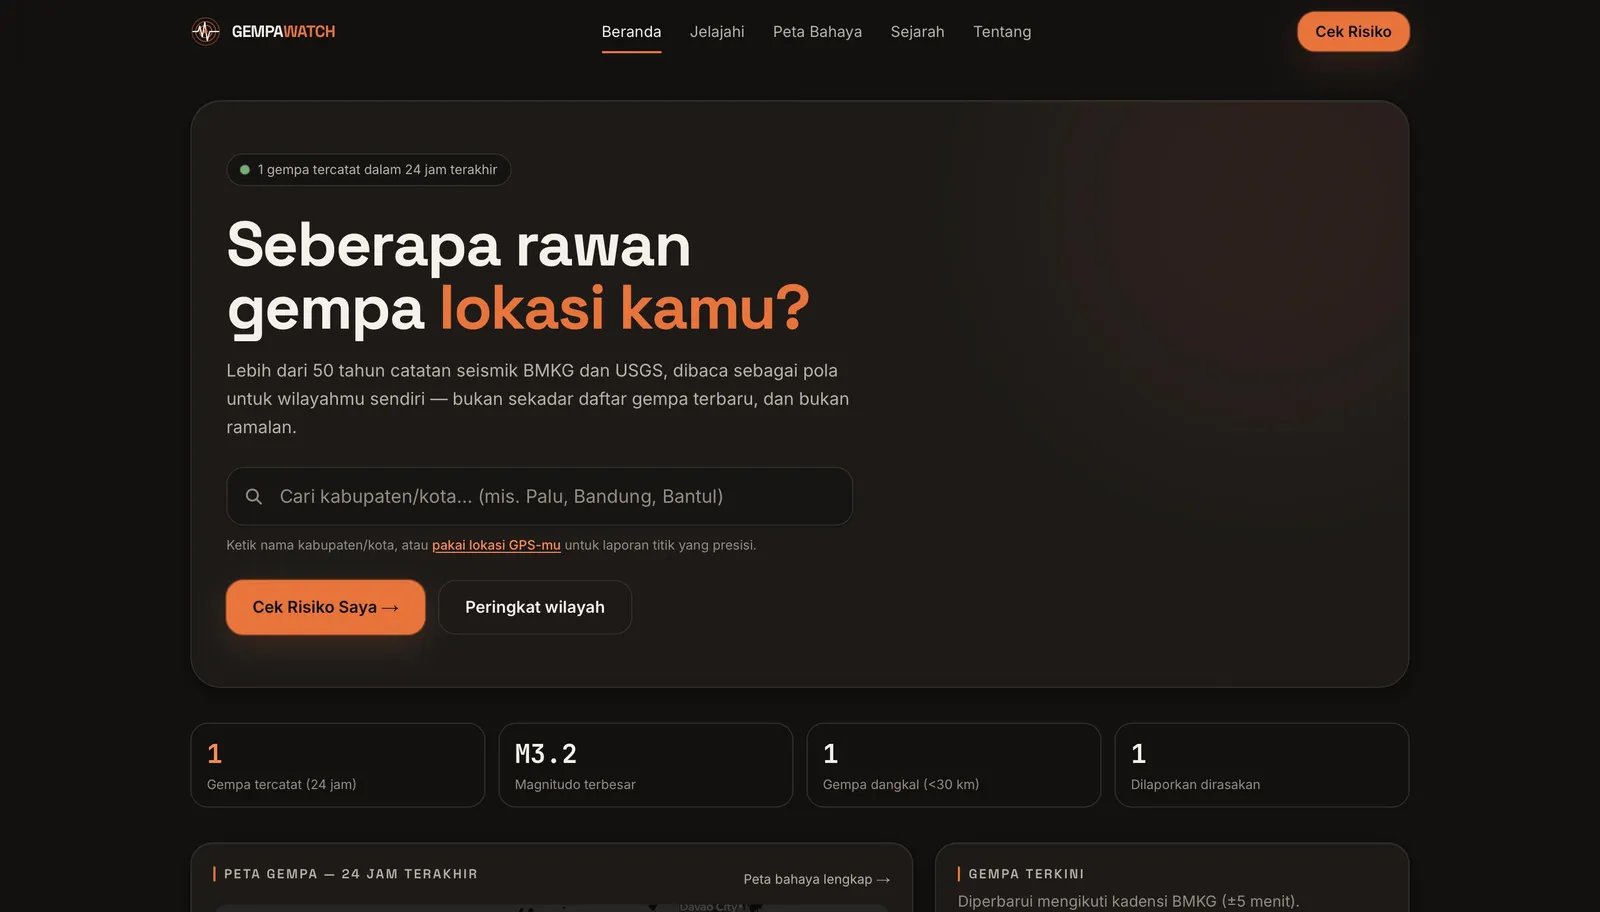

GempaWatch
A free public site that tells anyone in Indonesia how earthquake-prone their own area is — using 57 years of official records, not just the latest tremor
Solo Developer
Jul – Aug 2026
On this page
The problem
Indonesia is the most seismically active country on Earth, and there's no shortage of apps that list recent earthquakes. But a list answers the wrong question. The question people actually have is personal: "Is my city dangerous? Should I worry? Is it worse here than in Jakarta?"
Two structural gaps make that hard to answer. BMKG, the official Indonesian agency, publishes only its last 15 events per feed — authoritative on what just happened, silent on patterns. USGS has the full historical archive, but it's global, English, and returns raw GeoJSON no ordinary resident can use. GempaWatch merges the two — USGS for historical depth, BMKG for live authority and the smaller felt quakes USGS never records — and turns the combined dataset into a plain-language risk profile for a specific point on the map.
The approach
Spatial questions need a spatial database
Every meaningful question here is geographic — "events within 100km of here", "nearest fault line", "which region is this point in". Doing that with plain latitude/longitude columns means either wrong answers (Euclidean distance on a sphere) or full-table scans across ~70,000 events. PostGIS makes them indexed geographic queries instead. Regional profiles aggregate the entire history per region — far too expensive to run on page load — so a nightly Celery task rebuilds all profiles and the API just reads the cached result. The one exception is the "check my exact location" tool: one point, one radius, cheap enough to run live.
One honest number, not four raw counts
Nobody can interpret "217 M4+ events, 14 M5+, 2 M6+". A transparent weighted 0–100 score does the interpreting — frequency (40 points), largest recorded magnitude (30), share of shallow, more-damaging quakes (15), and closeness to a known fault (15) — every weight documented on a public methodology page. Regions are also ranked into a national percentile, so a resident gets "more seismically active than 84% of Indonesia" rather than a bare number. And never predictive language: historical framing only, with an explicit note that this is not a tsunami warning system and a link to BMKG's official alerts.
The pivot: the CI pipeline became the data pipeline
The original design was a server — Django on a VM, Celery polling every five minutes. A month in, the project pivoted to a backendless static build on GitHub Pages, which created a cascade of real problems, each solved rather than papered over:
- Freezing the API without payload drift. Rather than hand-write fixtures, a command drives the real DRF views and dumps their output to a JSON tree mirroring the live URLs. Two API clients sit behind one interface, chosen by a build-time constant so the unused one is tree-shaken out.
- Running the risk engine in the browser. With no backend, single-point checks couldn't hit Django, so the Python engine was ported to TypeScript. Because two implementations of a methodology will silently diverge, the port is gated by golden fixtures: Django's output is pinned at 39 points, and a test suite asserts the TypeScript reproduces every one exactly. The deploy refuses to ship on mismatch — a divergence would mean the static site reports different risk numbers than the API.
- Loading ~70,000 events on a phone. The client engine packs events into parallel typed arrays — ~1.1 MB instead of tens of MB of JS objects — and stays Float64, because Float32 can't hold a magnitude like 6.6 exactly and would reintroduce the very mismatch the fixtures exist to catch.
- Not losing BMKG history. BMKG exposes only its last 15 events, so every older record survives only because a past run saved it. The accumulated database is carried between ephemeral CI runs in the Actions cache — a working copy, not a backup — so it's backed up daily as workflow artifacts plus permanent monthly release-asset snapshots, both
continue-on-errorso a failed backup can never block publishing earthquake data.
Honest about the edges
The README states the costs plainly: static freshness is 70–90 minutes (GitHub's scheduler defers under load), email alerts need the server, and coverage is 24 admin regions — so the national percentile is against those 24, not all ~514 kabupaten. Nothing is faked; routes that need a backend are named *.live.tsx and only registered for live builds.
Outcome
Live and public on GitHub Pages, serving 69,641 earthquake events spanning 1970–2026, merged and deduplicated across BMKG and USGS — BMKG wins any duplicate, as the locally authoritative source. It ships a live 24-hour map, a geolocation "am I in a risk zone?" report, risk profiles for 24 regions with magnitude-frequency, depth, and event-timeline charts, a region leaderboard and side-by-side compare, a fault and hazard map, and shareable risk cards.
The shipped static site is genuinely production — it self-updates on a schedule, carries real accumulated data, has a two-tier backup strategy, and gates every deploy on a correctness test. Behind it sits a complete Django + Celery server application — the canonical implementation, runnable under Docker Compose. Built solo: 51 commits over ~5 weeks, ~19,000 lines changed, and a 320-line CI/CD workflow that doubles as the data pipeline.
- 69,641
- 24
- 39
- 51
Have a project like this?
If you need a system built with the same care — clear scope, solid execution — let's talk.
Start a project