 AFM Studio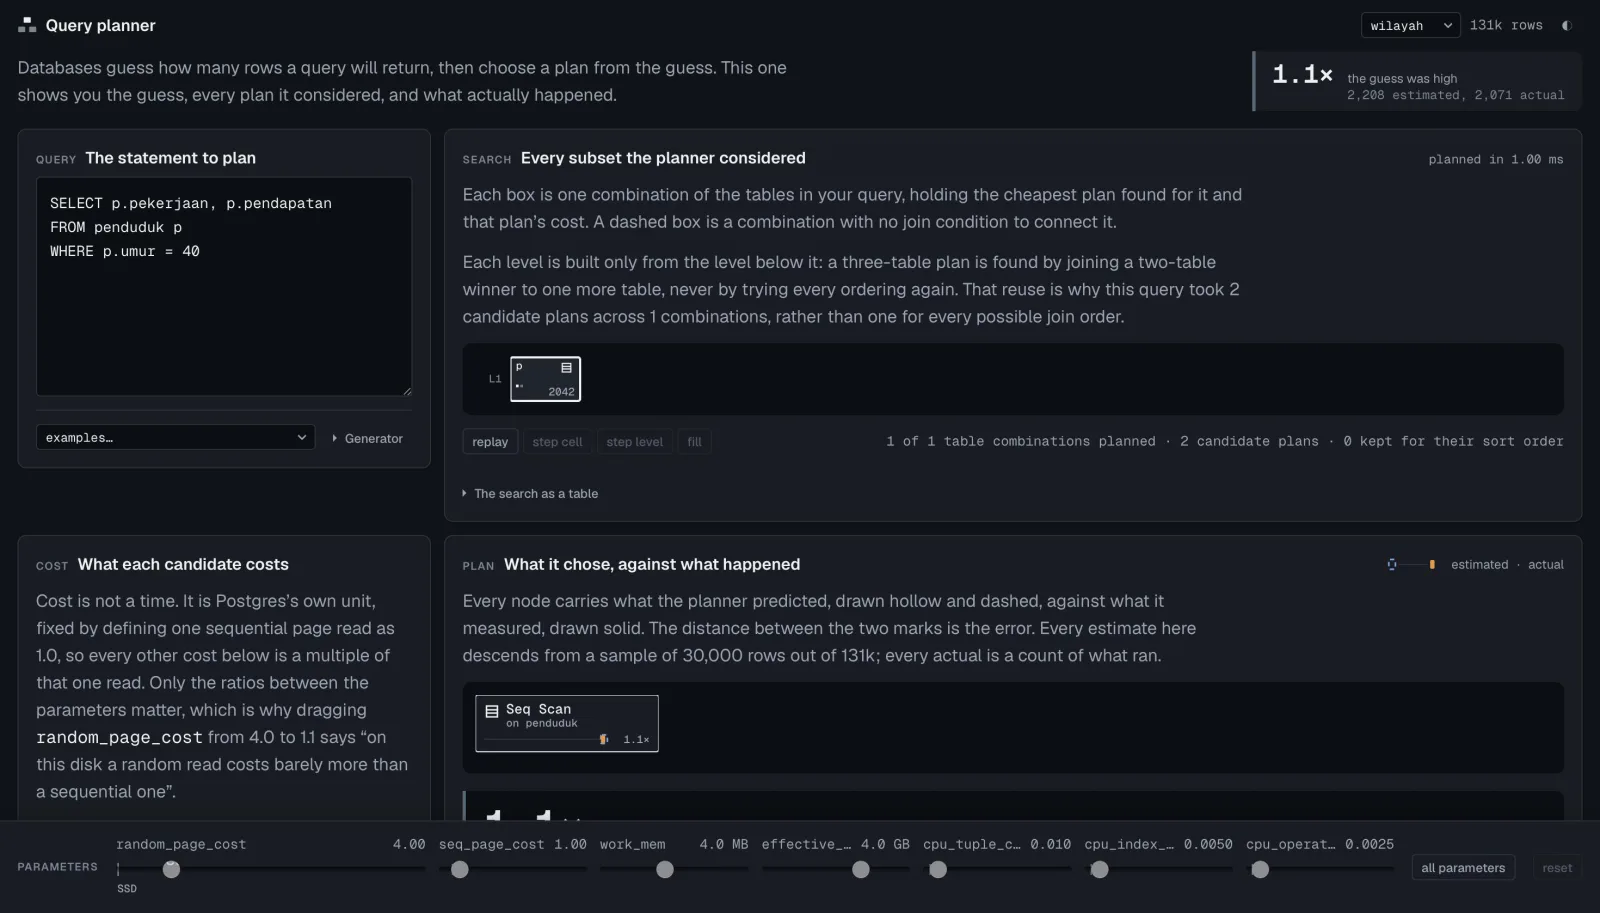

Query Planner
A browser-based SQL query planner and executor that shows every plan a database considered — not just the one it picked — and puts its estimate next to the truth at every step, so you can see exactly where and why it guessed wrong
Solo Developer
Sep 2026
On this page
The problem
When a SQL query is slow, the usual answer is "add an index" — and often that isn't the problem at all. A database picks how to run a query by estimating how many rows each step will produce, using a small statistical summary of the table. When those estimates are wrong, it confidently picks a plan that's catastrophically slow. Nothing is broken and no index is missing; the plan was chosen correctly from a false belief.
The specific failure this app is built around is the independence assumption: asked for city = 'Balikpapan' AND province = 'Kalimantan Timur', a database multiplies the two odds as if knowing the city told it nothing about the province. It predicts one row in ten thousand; the truth is one in a hundred — two orders of magnitude of error, from an assumption nobody chose. Standard tooling can't show this: EXPLAIN shows the winning plan and nothing else — not the dozens of candidates that lost, and not the gap between what the planner believed and what actually happened.
The approach
The app contains a whole database engine, in the browser
This is the central decision and everything else follows from it. Wrapping an existing engine like SQLite-in-WASM would have been far less work, but it can't do the two things the app exists for: show the losing candidate plans (EXPLAIN throws them away), and put the estimate and the truth side by side at every node from one system. Only an engine you control produces both — so it ships its own lexer, parser, columnar storage, B+tree index, statistics, cost model, Selinger dynamic-programming planner, and a volcano-model executor with nine physical operators.
The planner is architecturally forbidden from seeing the data
src/planner/ may not import src/storage/ or src/executor/ — enforced by an ESLint rule, not by convention. It reads statistics objects and nothing else. A planner that can peek at the truth is not a planner, and the whole demonstration would be a lie if this leaked. Every estimate it produces carries its own trace — the method used, the inputs, the assumptions made — and the interface renders that trace directly rather than recomputing anything, so the display can never drift out of sync with the math.
The DP keeps its garbage
Selinger enumeration normally discards losing candidates the moment a cheaper one appears. Here every candidate is retained in its own cell, along with the exact fill order of the search. For 8 tables that's 255 cells and trivial memory — and it's the only reason the lattice animation can replay the real search rather than a re-enactment. Interesting orders are retained too: without them merge join can never win, and the app would quietly teach something false.
Correctness is proven two ways, not asserted
Real Postgres, compiled to WebAssembly, is the test-time oracle: identical data goes into both engines, and 33 tests assert this planner picks the same plan shape. Separately, an equivalence test asserts that every possible plan for a query returns identical results — which is what actually catches executor bugs. Where this planner genuinely disagrees with Postgres, the divergence is documented with its cause rather than tuned away, and a test asserts each disagreement still diverges, so the list can't quietly go stale.
Outcome
Live and public: drag random_page_cost from 4.0 toward 1.1 — the standard SSD adjustment every DBA makes — and the cost bars re-sort and cross in real time as the winning plan rebuilds and re-executes, tracking the pointer with no easing; a four-table join re-plans in under 16 milliseconds, pinned by a performance test. The plan tree pairs the planner's guess with the real row count at every node and draws the error widening up the tree — 1.2× at a scan becomes 8× after one join and 300× at the root. The correlation view draws the independence assumption as a literal rectangle detached from the actual point cloud, and creating a multivariate statistic in one click snaps the rectangle onto the truth and re-executes the query with the corrected plan.
Sole author, 36 commits in a single ~16.5-hour session, ~13,500 lines of TypeScript across the whole stack, 294 tests. Three runtime dependencies — no SQL library, no charting library, no graph-layout library, no animation library, no state-management library. The entire app state serializes to the URL, so a surprising plan is a link someone can send, and every query runs against data that never leaves the browser.
- 294
- 255
- 3
- 98KB
Have a project like this?
If you need a system built with the same care — clear scope, solid execution — let's talk.
Start a project