 AFM Studio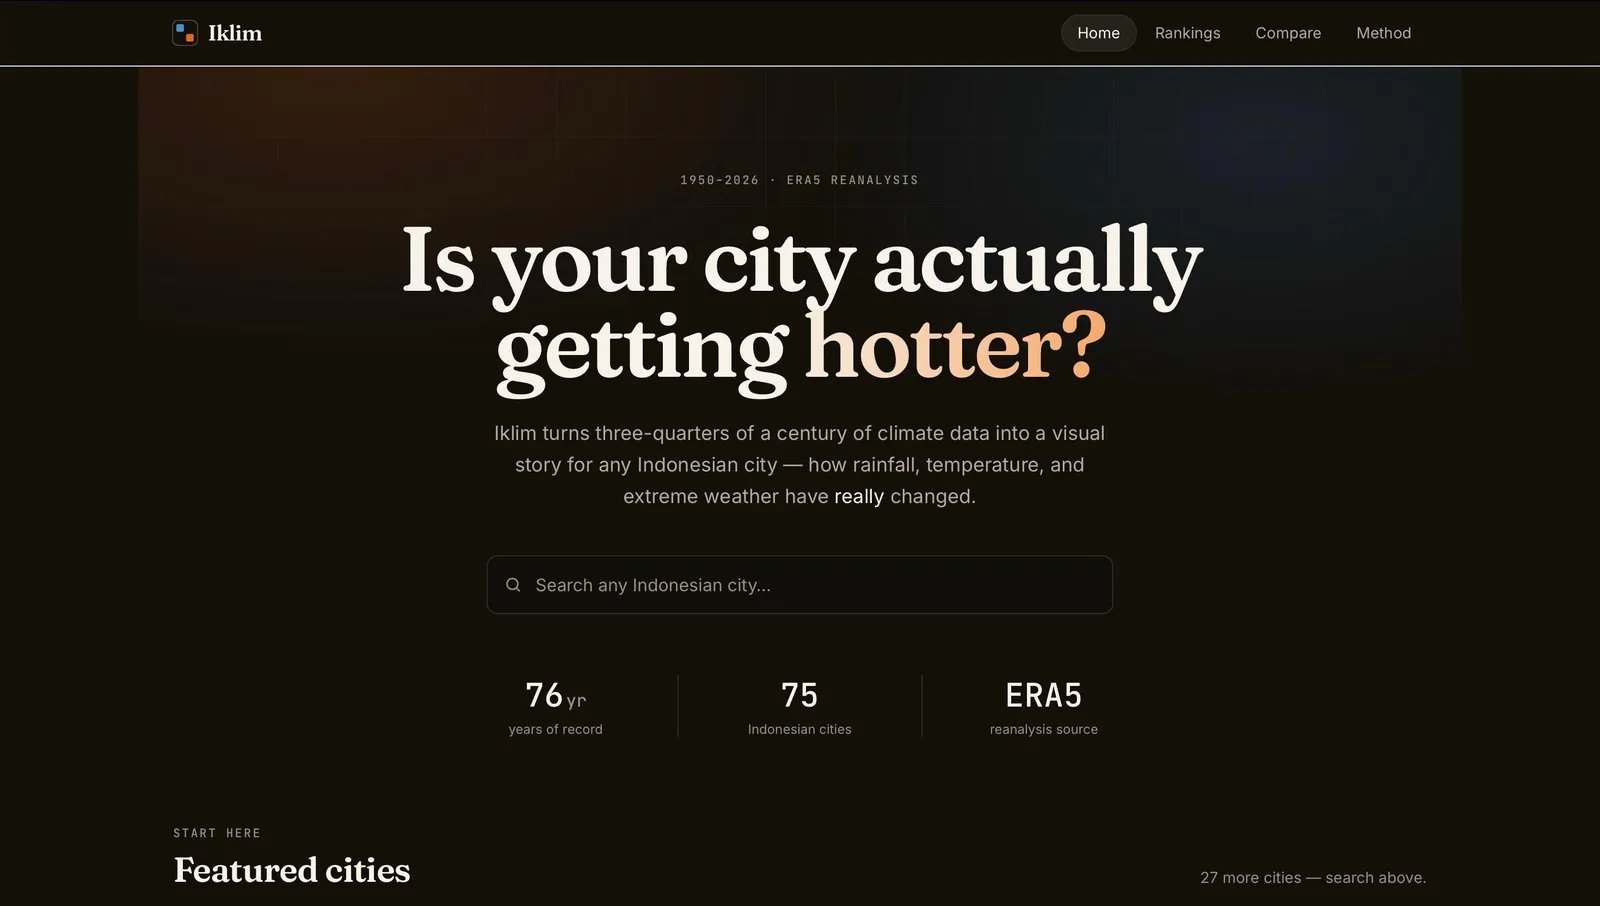

ClimateWatch
75 years of Indonesian climate history turned into plain visual answers for 75 cities — free, no login
Fullstack Developer
Jul 2026
On this page
The problem
Climate change is discussed constantly in the abstract, but almost nobody in Indonesia can point to their own city's actual numbers. Historical weather data exists through global reanalysis datasets, but it's raw, ungrouped, and inaccessible to a non-technical reader. ClimateWatch's job is to take decades of daily temperature and rainfall records and turn them into charts a curious person, student, journalist, or farmer can read in seconds — not a spreadsheet they have to interpret themselves.
The approach
Reanalysis data, not sparse ground stations
Indonesia's ground weather station coverage is sparse, so ClimateWatch uses ERA5 — a satellite and model-based historical reanalysis dataset served through Open-Meteo — which gives gap-free daily data back to 1950 for any latitude and longitude, station or not.
Precompute, never aggregate on request
Raw daily rows, potentially millions per city, are rolled up into monthly and annual summary tables ahead of time by scheduled Celery jobs, so every page load is a fast read against a small precomputed table instead of a live aggregation over decades of rows. The daily data itself lives in a TimescaleDB hypertable — a Postgres extension purpose-built for time-series at scale — partitioned by date with a composite (region, date) index matching the main query pattern. TimescaleDB hypertables reject a surrogate primary key outright, since any unique index must include the partition column; the schema was built around a composite (region, date) uniqueness constraint from the start rather than working around it later.
Missing data is data
Nulls from the source API are stored as NULL, never coerced to zero — 0mm of rain and "we don't know" are treated as materially different, which matters in a domain where "no measurement" is genuinely common in older reanalysis periods.
Resilience against a free, unauthenticated API
Open-Meteo has no key and no hard rate limit, but is still rate-limited in practice. A 75-year single-shot fetch per region wasn't reliable, so ingestion chunks each city's history into 25-year windows, backs off on 429 responses with or without a Retry-After header, and can resume a partially completed bootstrap without re-fetching cities that already succeeded — necessary for a multi-hour ingestion run across 75 cities that has to survive being interrupted partway through. A seed_demo command generating clearly labeled synthetic data keeps the app fully demoable even without access to the live API.
D3 reserved for the one component that needs it
Every other chart uses Recharts; only the signature calendar-heatmap "Climate Fingerprint" — a bespoke interaction and rendering problem — uses hand-rolled D3. The color ramps had a real perceptual bug caught after initial release: on the dark canvas, a light-to-dark interpolator made zero rain the brightest cell on the grid. Each variable now uses a single-hue ramp anchored dark-to-vivid instead, verified monotonic in both lightness and saturation, so the highest-magnitude value reads as visually "most intense" rather than fading to a pale tint at the top.
A design system that survived a mid-project inversion
ClimateWatch shipped first with the PRD's warm light "Musim" palette, then pivoted two weeks in to a full dark "Musim Nokturnal" redesign — keeping the same earth-toned identity on a warm volcanic-ink canvas rather than a generic blue-slate dark mode. Every data-encoding color was validated against the real surfaces for WCAG contrast and monotonic perceptual intensity, with color always following the entity (city A is always the same series color across every chart) rather than the metric.
Outcome
38 commits over roughly two weeks of active building (with a gap between two pushes of features), covering 5 core models, 11 API endpoints, and 6 frontend routes — about 1,980 lines of backend Python and 3,525 lines of frontend TypeScript. Coverage grew past the original plan: 75 seeded cities with full 1950-to-present daily data, versus the PRD's original 84-city target at similar order of magnitude. Beyond the core fingerprint, extreme-weather tracking, and wet-season-shift detection, the build added cross-city rankings and ENSO impact analysis that weren't in the original scope, plus a homepage coverage map built from real Indonesia coastline topojson data rather than a bounding-box placeholder. Runs as a working local build with a public repository; CMIP6 2050 projections and full 514-kabupaten coverage remain explicitly out of scope for this version.
- 75
- 15
- 38 min → 44 sec
- 45
Have a project like this?
If you need a system built with the same care — clear scope, solid execution — let's talk.
Start a project