 AFM Studio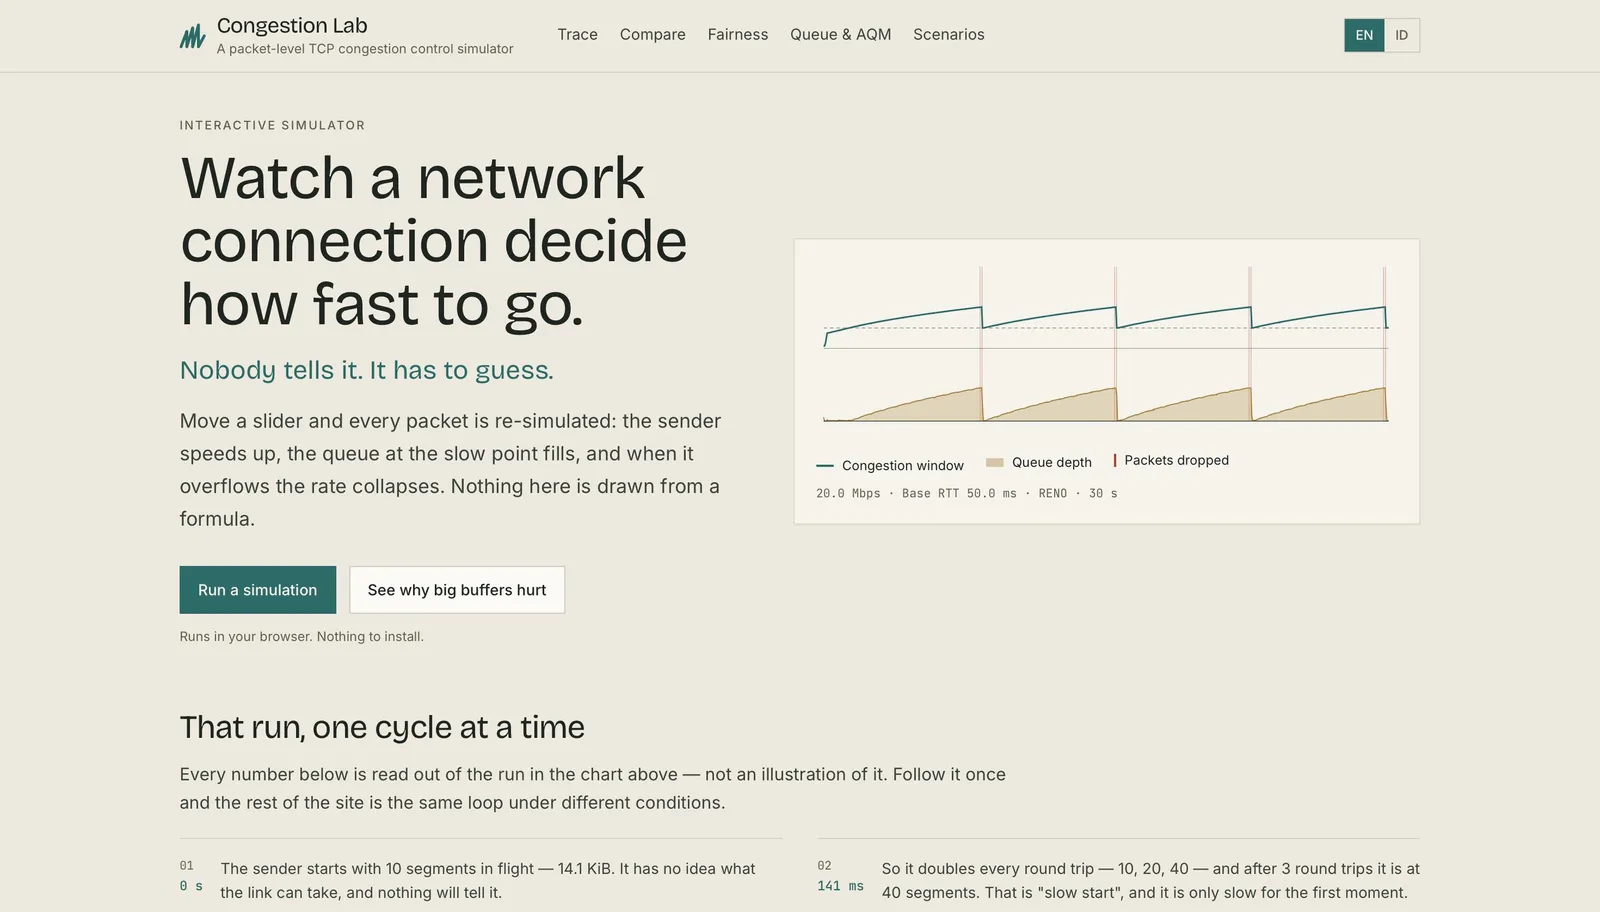

Congestion Lab
Shows, packet by packet, how the internet decides how fast to send data — and why your video call stutters the moment someone in the house starts a download
Solo Developer
Aug 2026
On this page
The problem
TCP congestion control governs the speed of essentially every internet connection, and it's taught as a picture — the "sawtooth" — that most people never see produced. Four practical consequences the project targets directly:
- People blame bandwidth for latency problems. Window growth happens once per round trip, so a server 300 ms away recovers from a lost packet six times slower than one 50 ms away on identical bandwidth. That's invisible without a simulator.
- "Slow start" is misnamed — it doubles the window every round trip: slow to begin, then explosive. The name teaches the opposite of the behaviour.
- Bufferbloat is invisible. Oversized router buffers mean loss now happens long after the queue filled, so loss-based algorithms add seconds of latency without dropping anything. This is the mechanism behind "the call got bad when the download started".
- Fairness is assumed rather than understood. AIMD's convergence to an equal share is a proved geometric property that fails in specific, predictable ways.
The approach
The sawtooth is emergent, never drawn
The central decision: individual packets are scheduled onto a virtual clock, serialised onto a link, queued, dropped, and acknowledged — and the window curve is whatever the algorithm did in response. No curve is ever produced from a formula. A simulator that draws the shape it expects can never surprise you, and the project's whole value is in its surprising results being trustworthy.
Correctness carried by analytic oracles, not by looking at it
A wrong simulator still produces a convincing sawtooth. So four independent published predictions — the Mathis throughput equation, utilisation-vs-buffer-size, RTT unfairness, and AIMD fairness convergence — are asserted as sweeps (not single points) and gate the deploy. A simulator that stops reproducing Mathis cannot ship. Packet conservation (sent = delivered + dropped + in flight) is asserted at every event in every suite, and the engine is deterministic to the point of integer-nanosecond time with equal timestamps broken by an explicit sequence number — because floats in a scheduler accumulate error that won't reproduce, and an algorithm comparison is only meaningful if it's byte-identical everywhere.
One sender skeleton; congestion control as plugins
Every algorithm implements the same four-method interface (onAck, onLoss, onTimeout, canSend) — there's no if (algorithm === 'cubic') in the sender and no forked sender per algorithm, so the comparison view measures algorithms, not implementations. A 60-second 100 Mbps run is roughly half a million packets, so trace hot fields live in typed arrays and the simulation runs in a Web Worker, benchmarked at M0 before any UI existed: 288k packets in ~0.5 s with flat heap growth.
Where the model refuses, and where reality surprised it
Mechanisms that can't be modelled faithfully are recorded as gaps and shown where they affect a result, rather than guessed. And a real phenomenon inverted an oracle — over deterministic DropTail the model shows a strong Floyd–Jacobson phase effect sharp enough to reverse the expected RTT bias — so rather than loosen the oracle, the fairness scenarios were moved onto RED and the phase effect is asserted explicitly. When an oracle fails, the simulator is wrong; the tolerance is never widened.
Outcome
Live and public, bilingual (Indonesian default), accessible (keyboard-navigable chart with an aria-live readout, screen-reader prose summaries), fully static. Its signature view is the four-series trace — congestion window, bottleneck queue depth, throughput against the capacity line, and RTT sharing one x-axis with exact vertical alignment, so a straight read down at any instant shows why the window did what it did. Plus algorithm comparison across Tahoe, Reno/NewReno, CUBIC, Vegas, and BBR v1 (each citing its RFC in code and UI); the bufferbloat demonstration — the same flow over a deep DropTail buffer versus CoDel, throughput barely differing while RTT differs by an order of magnitude; fairness analysis with Jain's index and the Chiu-Jain phase diagram; a plain-language findings layer that turns a completed run into cited sentences; and nine curated scenarios, all shareable by URL.
Built solo in one ~10-hour day — ~12,100 lines of TypeScript with a ~3,600-line simulation core, 148 tests behind four deploy-gating oracles, on three runtime dependencies and no simulation or charting library (the scheduler and the hand-written SVG plots are the project). It states plainly that it models the published algorithms and claims no parity with a Linux kernel stack.
- 5
- 4
- 288k
- 0
Have a project like this?
If you need a system built with the same care — clear scope, solid execution — let's talk.
Start a project