 AFM Studio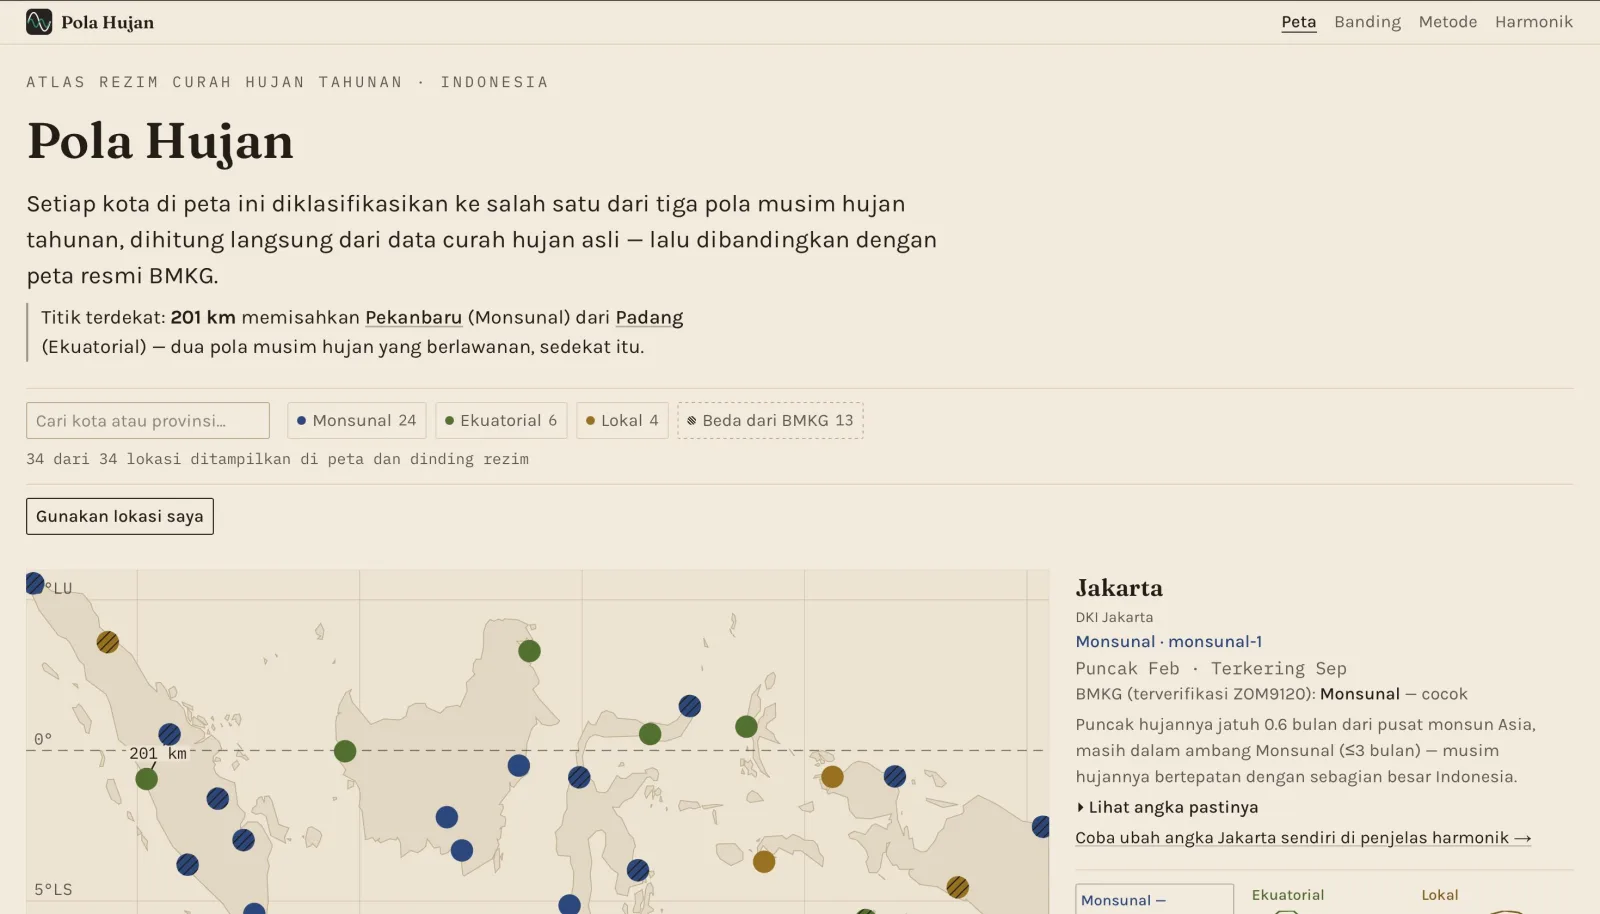

Pola Hujan
Indonesia doesn't have one rainy season — it has three rainfall patterns, and this atlas derives them from satellite data instead of copying the official map
Solo Developer
Aug 2026
On this page
The problem
Indonesians are taught the country has two seasons — musim hujan and musim kemarau, rainy and dry. That is true for Java, and wrong almost everywhere else. Ambon's wet season falls exactly opposite Java's. Parts of the equatorial belt get two wet peaks and two dry peaks a year rather than one of each. BMKG, Indonesia's meteorological agency, already knows this and publishes 699 official season zones grouped into three families — Monsunal, Ekuatorial, Lokal — but that knowledge sits in PDF bulletins and expert judgement over a station network, not in anything a curious person can open and explore.
Pola Hujan is built for a general Indonesian audience who want to understand why "rainy season" means different things in different places. It is deliberately not a planting calendar and not a forecast: it describes long-term climatology, and says so on its own face.
The approach
The classification is derived, not traced
The obvious build is to digitise BMKG's published zone map and colour it in. This does the opposite: it computes its own classification from raw satellite rainfall using harmonic analysis — the same maths used to describe tides. A location's twelve-month rainfall cycle is treated as a wave and decomposed into an annual component and a twice-a-year component. Whichever is stronger, and where its peak falls in the calendar, decides the family. The result is independently checkable rather than a re-skin of someone else's polygons.
Thresholds are cited, and never tuned toward agreement
The cutoffs deciding how strong the semi-annual signal must be before a place counts as two-wet-season live in a single file, each citing the 2003 Aldrian & Susanto paper the three-family framework comes from. The project's own rule is that disagreement with BMKG is reported, never tuned away — nudging a threshold until the map matched would convert an analysis into an imitation. Two verified disagreements (Medan, Palu) are left standing as findings, and a dedicated layer shows exactly where the derived map departs from the official one, with citations.
Correctness proven on synthetic data before real data
A generator builds a fake rainfall cycle from known wave parameters; the classifier runs on it and must recover those exact parameters. That includes a permanent regression case for a cycle peaking six months from Java's, which has to come out as the inverted family. Correctness is demonstrated mathematically rather than eyeballed against a map — before the classifier is ever pointed at CHIRPS.
Real satellite archives, decoded by hand
The pipeline downloads genuine CHIRPS precipitation archives and decodes the BIL raster and tar formats with hand-written decoders rather than pulling in GDAL. The dependency budget is deliberate and enforced: no charting library, no mapping or GIS library, no statistics library, no ML. Everything — fetch, harmonic fit, classification — runs once at build time, so the shipped site is a static export with zero runtime network calls and no hosting bill.
The honesty layer is part of the product
The method page publishes the dataset citation, the exact thresholds, a computed agreement rate against BMKG generated by the pipeline rather than asserted in prose, a downloadable CSV of the full dataset, and the limitations. Chief among them: the regional CHIRPS archive stops updating in October 2016, so this is a ten-year climatology (2006–2015), not the thirty-year WMO standard a production tool would use. That is stated in the open rather than buried.
Outcome
64 commits over a three-day build, roughly 3,140 lines of TypeScript across the app, pipeline and analysis library, with 54 tests across 7 files gating CI. Four routes: the regime atlas, a two-place comparison built around the Jakarta-versus-Ambon finding, the method and transparency page, and a live harmonic explainer whose sliders let a visitor morph a synthetic rainfall cycle between the three families and watch the classification change — turning the method itself into something playable rather than something described.
Coverage grew from 15 to 34 sampled locations almost for free, because CHIRPS download cost is dominated by the 120 monthly rasters fetched rather than by how many points are sampled from them. Verification went from 0 to 14 of 34 BMKG comparison labels checked against the agency's own 139-page bulletin, page numbers cited — which caught and corrected a mislabelled location (Ternate) in the initial hand-entered data. The remaining 20 are still best-effort estimates, and the site says so. An accessibility and plain-language pass — contrast, ARIA descriptions replacing title attributes, screen-reader selection announcements, a 16px body-text floor — shipped as its own milestone after the build was feature-complete. English routing remains deferred; the live site is Indonesian only.
- 34
- 14/34
- 0
- 54
Have a project like this?
If you need a system built with the same care — clear scope, solid execution — let's talk.
Start a project