 AFM Studio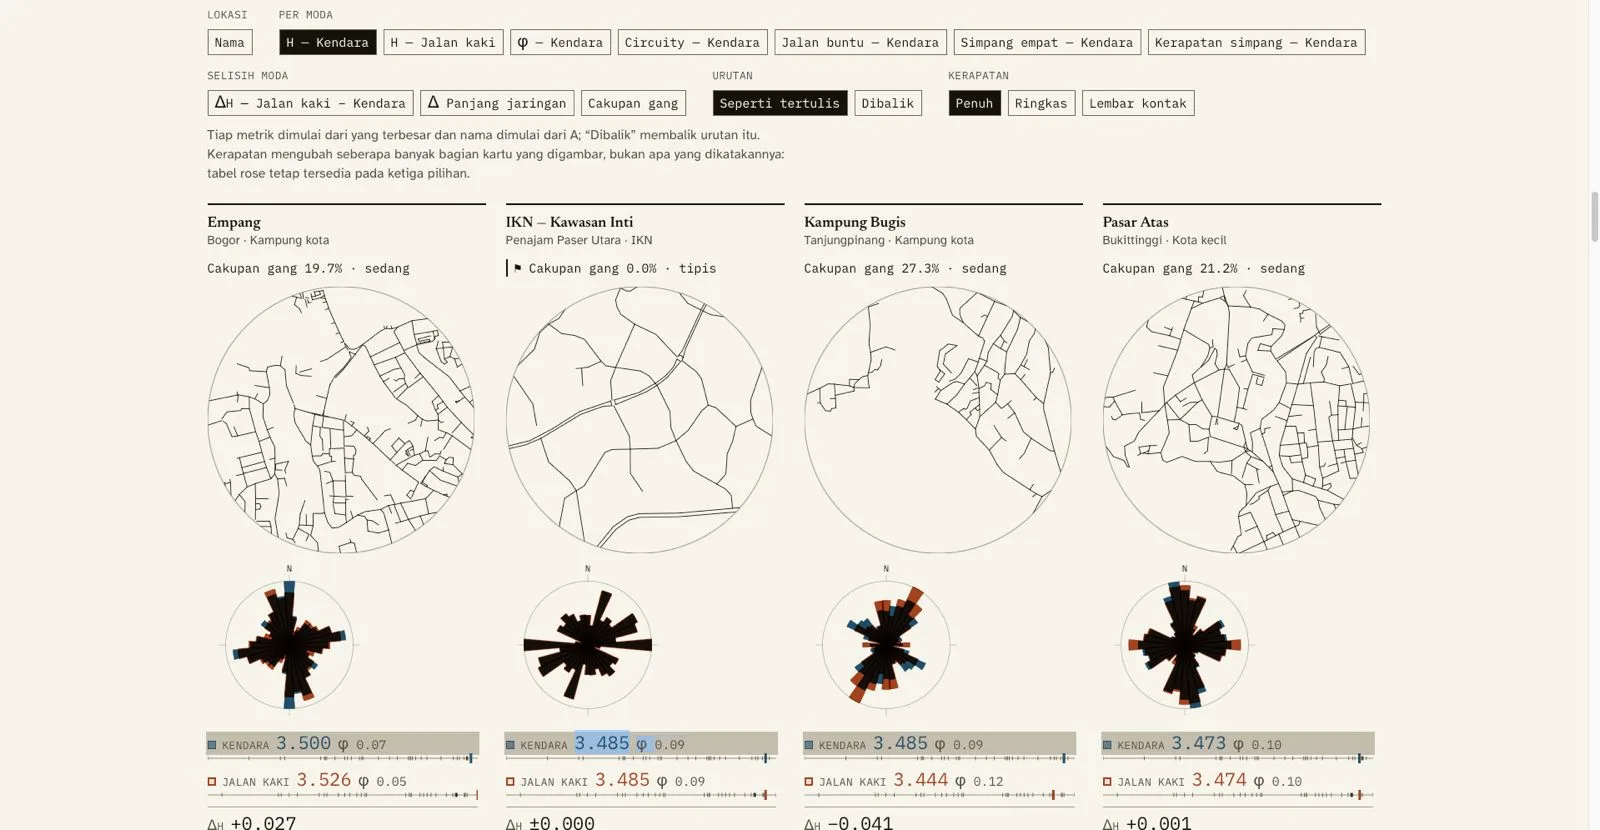

Bentuk Kota
Measures the street layouts of 33 Indonesian neighbourhoods twice — once by car, once on foot — because the standard academic metric only sees the driving network and misreads a kampung completely
Solo Developer
Aug 2026
On this page
The problem
The standard academic method for measuring street patterns — Boeing's 2019 orientation entropy — is computed on driving networks. That makes Indonesian urban form largely invisible to it. A kampung is threaded with gang, pedestrian alleys that never appear in a car network at all. A gated perumahan is drivable but has one or two entrances and dead-ends everywhere. Measured by car alone, both come out wrong, in opposite directions.
This project computes both networks — driving and walking — for the same disc of the same city, and puts them side by side. The gap between the two is the finding. It is simultaneously a real measurement of Indonesian cities and a critique of applying car-centric metrics to cities that don't work that way.
A deliberate ethical constraint shapes the whole product: kampung-versus-perumahan carries class overtones in Indonesia, so the app describes and never scores. There is no ranking, no walkability grade, no liveability index anywhere in it, and a dedicated test holds the guardrails that stop the distribution ruler from being readable as one.
The approach
The maths is the project, so nothing was imported
No graph library, no charting library, no mapping library. Graph construction, bearing computation, binned orientation entropy, the φ orientation-order indicator, circuity sampling, degree statistics and footway-coverage measurement are all hand-written pure TypeScript, implemented from the paper with sections cited in the comments. The measurement core takes numbers in and returns numbers out — no DOM, no React, no clock, no network — which is what makes it provably correct and lets the same code run in the pipeline and in tests.
Correctness by construction, not by inspection
There is no oracle for "what is the real entropy of Bendungan Hilir", so the tests don't look for one. They build networks whose answers are known in advance — a perfect grid, that same grid rotated 29°, a random graph, a pure tree — and check the measured values come back right. Mathematical invariants are then asserted on every histogram, synthetic and real alike: every rose must be 180°-symmetric, circuity is ≥ 1 by definition, degree proportions sum to 1.
Assumptions are controls, not constants
Which OSM tags count as "drivable" or "walkable" changes every number on the site. Rather than bury that choice, the tag mapping lives in one documented module, is exposed in the UI as a switchable control across three mappings, and has its sensitivity reported on its own page. The reader can see how much the conclusion depends on the modelling decision.
Sites found by measuring, not by remembering
The original plan was a hand-curated site list. Hand-listing produced 10 usable sites from 49 guesses — and the misses proved nothing, because an unconsidered neighbourhood is not a rejected one. The pivot was a density sweep across 56 cities that bins every mapped footway into disc-sized cells and ranks candidates by measured coverage. It contributed 14 of the 33 final sites, including the first discs in Papua, Lombok and Kalimantan.
The proxy's failure modes, found the hard way
Footway coverage cannot tell an alley from a garden path. Bogor's best-covered candidate — the highest coverage ever surveyed at 40.9% — was a botanical garden; Jakarta's best was 78% inside a single park. That produced encoded rules (a >25% park share is not urban fabric; landuse=grass is fetched and then ignored, because mappers use it for roadside verges) and a validation check requiring the survey to predict the pipeline within one percentage point, which caught two sites entered with stale coordinates.
Outcome
93 commits over eight days, roughly 11,000 lines of TypeScript across a 2,100-line measurement core, a 2,600-line pipeline, components, pages and 1,500 lines of tests. 577 tests in 14 files, with three gated suites — synthetic, invariants, data validation — plus an accessibility audit standing between a commit and production.
Every site publishes how well its alleys are actually mapped, and thin sites are flagged rather than silently compared, because missing map data would fake the headline finding. The finding itself is honestly bounded: every gated-housing candidate sought directly came back thin, at 0.9–4.4% coverage, so the kampung-versus-perumahan comparison rests on two readable gated sites out of three — stated as a number on the page rather than omitted. One commit exists purely to correct a published sentence the data had outgrown.
The site ships effectively zero client-side JavaScript: cards, sorting, density modes and cross-card highlights are all server-rendered HTML and CSS, with state in the URL, so a thousand SVG paths per site never cross the hydration boundary. Contrast ratios and the type scale are recomputed by unit tests from the hex values beside them, so the design system is checked rather than remembered.
- 33
- 126
- 577
- 4
Have a project like this?
If you need a system built with the same care — clear scope, solid execution — let's talk.
Start a project