 AFM Studio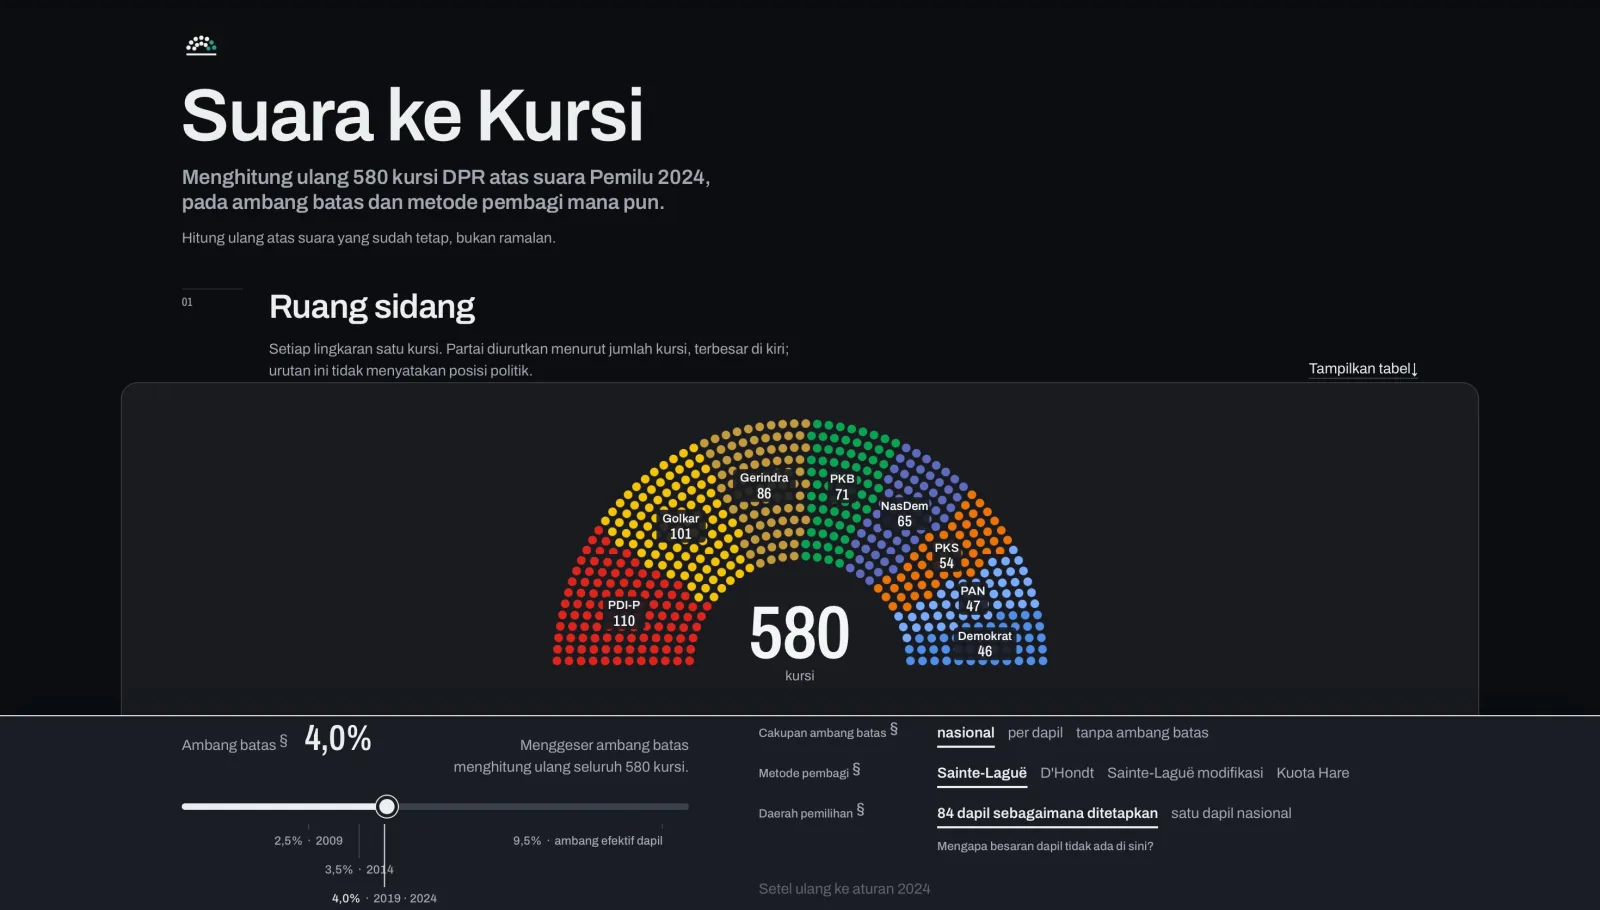

Suara ke Kursi
Shows how 151.8 million Indonesian votes became 580 parliamentary seats, and lets anyone drag the election threshold or swap the divisor method and watch the entire parliament recompose seat by seat
Solo Developer
Sep 2026
On this page
The problem
Indonesia elects its national parliament through two rules almost nobody can actually perform by hand: a 4% national vote threshold — a party below it converts none of its votes to seats anywhere, including in districts where it came first — and Sainte-Laguë highest averages, where each of 84 electoral districts awards its seats by repeatedly dividing party votes by 1, 3, 5, 7 and so on. In the 2024 election, 18 parties contested, 8 cleared the threshold, and over 17.3 million valid votes produced no seat at all. One incumbent parliamentary party missed the threshold by roughly 0.13 percentage points and took zero seats.
This isn't academic: Indonesia's Constitutional Court held the 4% figure constitutional for 2024 only, and ordered the legislature to reformulate it before the next election under conditions that include minimizing votes that convert to nothing. The court, in effect, ordered a calculation — and nobody had shipped a public instrument that performs it.
The approach
A pure engine, isolated from everything
The allocation engine imports nothing — no React, no DOM, no dates, no randomness. One synchronous, deterministic function takes party data, district data, and a rule set, and returns the full allocation. It runs unchanged in a plain Node script, which is what makes the result independently checkable rather than a claim the interface makes about itself.
The computation and its display are the same object
Each seat award records the complete quotient table at the moment it was claimed. The "show your work" cascade view renders that array directly — it never recomputes, so the picture can't gradually stop describing the arithmetic underneath it, which is a common failure mode in explainer visualizations.
Fast enough that no async machinery is needed
A full recomputation across all 84 districts runs at 0.23 milliseconds median, against a 16-millisecond budget. That means a threshold slider can recompute the entire parliament on every animation frame it's dragged through — no debounce, no idle callback, no web worker — and a single animation loop interpolates all 580 seats' positions and colors in one pass rather than mounting hundreds of independently animated components, which is the difference between smooth motion and dropped frames on a phone.
Reproduction is the license to be believed
The app must reproduce the certified 2024 election result exactly before it's allowed to offer any counterfactual, and that check runs in CI and blocks the build. When the underlying data can't yet support it — the district-by-party vote table exists only inside scanned government recapitulation documents, and extracting it by hand wasn't complete at time of writing — the interface says so plainly in its header rather than presenting a working-looking screen. Three of the four required data files hold real certified figures, so everything computed from national totals is real, including the unconverted-vote count, which matches an independent civil-society tally to the vote.
Outcome
Live and public: drag the national threshold from 4.0% toward zero and individual seats travel along paths from one party's block to another — never a redraw, never a crossfade — and the moment the slider crosses roughly 3.87%, the party that missed out in the real election enters the chamber. Four rule knobs (threshold, threshold scope, divisor method, and district geometry) are all reproducible from the URL, so an argument about a hypothetical 2% threshold is a link someone can send. Every rule cites its exact legal article and every headline figure cites its source document, through a dismissible, keyboard-reachable popover rather than a tooltip that vanishes on mouse-out.
Sole author, 42 commits over roughly 28 hours, ~8,000 lines of code, 40 tests with every expected value hand-computed on paper before being written. Five runtime dependencies, no backend, no analytics — four static JSON files are the entire data layer. Zero axe-core accessibility violations across three viewport widths in both color schemes, and every one of the five hand-built visualizations has a full keyboard-reachable table equivalent, because the hemicycle is not the only way anyone should be able to get the numbers.
- 17,304,303
- 0.23ms
- 40
- 0
Have a project like this?
If you need a system built with the same care — clear scope, solid execution — let's talk.
Start a project