 AFM Studio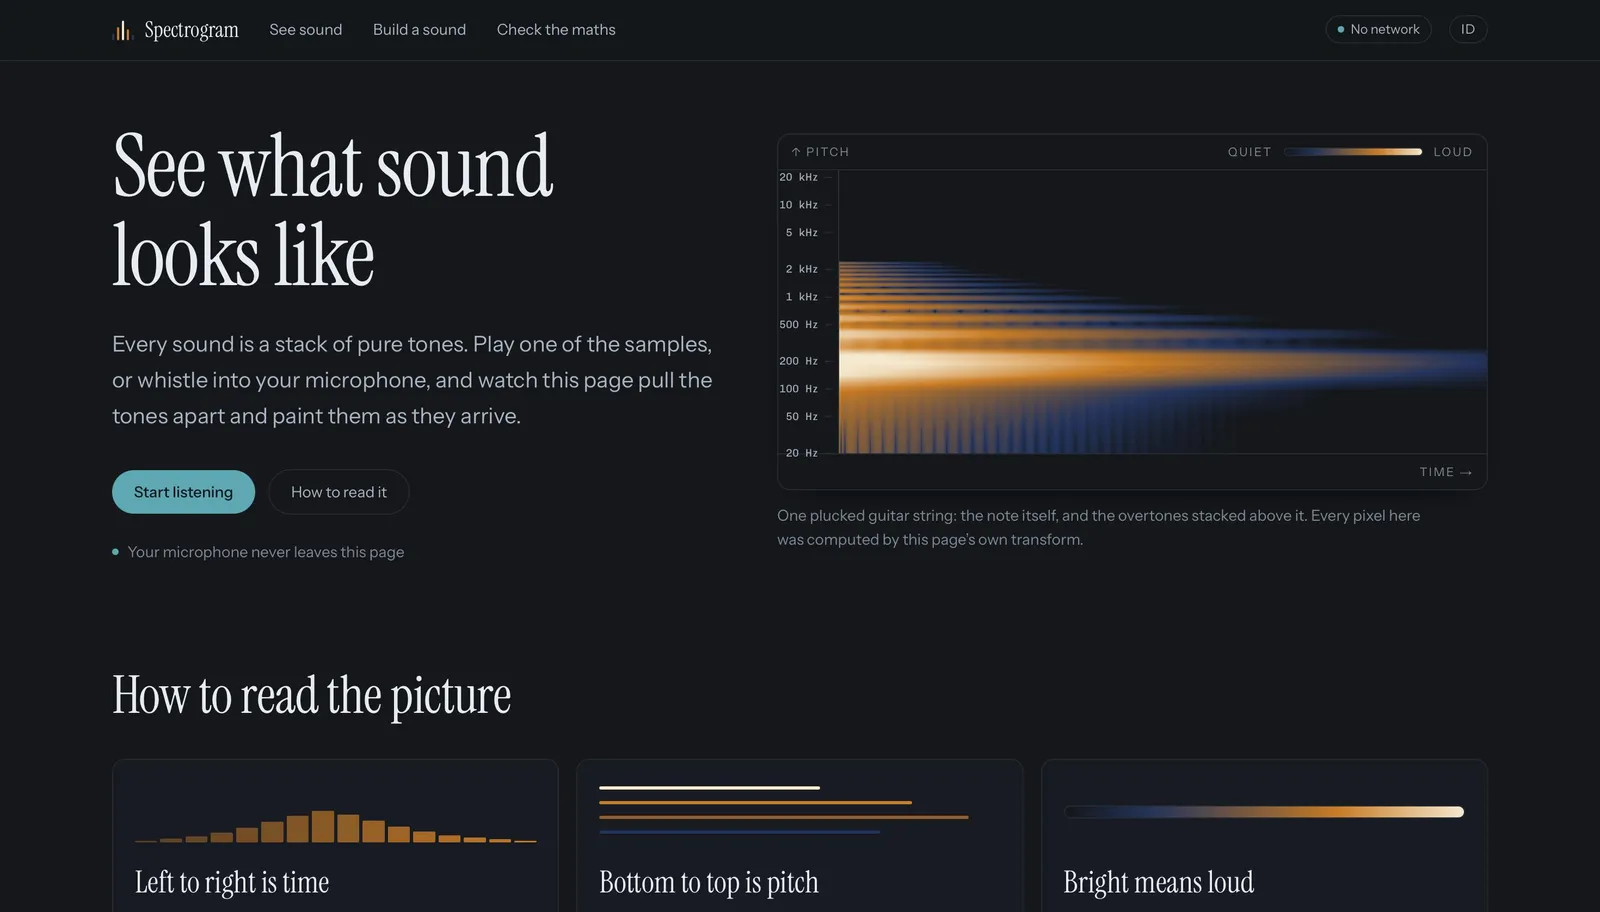

Spectrogram
Turns sound into a picture in real time — speak, whistle or play into your mic and watch which pitches are present — with the underlying mathematics written from scratch, not borrowed from the browser
Solo Developer
Aug 2026
On this page
The problem
A waveform — the squiggle everyone recognises — shows how loud a sound is, but not what pitch it is: a low hum and a high whistle look the same. A spectrogram answers the other question, and it's how speech recognition, music software, bird-call identification, and audio forensics all actually look at sound. Two audiences, and the project serves both:
- A curious learner who has heard of "the Fourier transform" and wants it to become intuitive rather than an equation. The core lesson is the time–frequency tradeoff: you can't have sharp timing and sharp pitch at once — sharpening one blurs the other. Turned into a control you drag, it lands in about four seconds where a paragraph fails.
- A technical reviewer evaluating whether the author can implement a non-trivial numerical algorithm correctly, not just call a library. The browser ships
AnalyserNode, which draws a spectrogram in ten lines and proves nothing. This project's claim is the transform itself — and that it's provably right.
There's also a trust problem: any site asking for microphone access owes the visitor a straight answer about where the audio goes. Here the answer is "nowhere", and it's structural — zero network requests at runtime, verified by a test and by a build-time check that fails the deploy.
The approach
The transform was verified before any interface existed
The first six commits are the FFT and its tests; the first UI commit is the seventh. The reasoning is specific: a wrong FFT still draws a beautiful picture. A subtly broken transform produces a plausible, attractive spectrogram, and no amount of looking reveals the bug. So four independent correctness signals were built first, each catching what the others miss: a naive O(n²) DFT oracle (the literal textbook definition, checked across every size and a seeded random corpus); Parseval's identity (one scalar that must hold for every input, catching scaling and indexing bugs); a round trip (FFT → inverse → original, catching normalisation errors); and analytic fixtures (DC, bin-centred sine, unit impulse, and the exact leakage kernel at a half-bin offset — each checkable by hand).
Speed came from data layout, not cleverness
Real and imaginary parts live in separate Float64Arrays rather than {re, im} objects; the transform runs in place; twiddle tables, window coefficients, and output buffers are allocated once per configuration and reused. Nothing is allocated per frame, because a garbage-collection pause at 60fps reads to a user as a broken app — so the benchmark asserts flat heap growth over a minute of sustained analysis, not just throughput. Analysis runs off the main thread in a Worker; the plate is a scrolling bitmap — a ring buffer of columns blitted as one ImageData per frame, never a redraw of the history.
Privacy enforced by the build, not promised in copy
A test scans source for any outbound reference, and a finalize step scans the built output for anything the browser would resolve — src, <link href>, srcset, url(), @import — plus a known-tracker denylist, failing the build if one appears. The one exception is four footer profile links, pinned individually by URL in both guards, because an anchor is not a fetch. The naive version of this check (fail on any https://) was rejected as unusable — framework error strings and licence headers contain URLs never fetched — so it targets references the browser will actually resolve.
An honest proof page
The comparison view runs the hand-written FFT beside the browser's AnalyserNode on identical input, with per-bin difference and timing for both — and it's honest in its framing: the native one is faster, and speed was never the claim. Getting the comparison fair required matching the spec's Blackman window, matching its exact dB scaling with no one-sided doubling, and using a stationary bin-centred input so frame alignment stops mattering.
Outcome
Live and public, bilingual, fully offline-capable. It ships the live plate (mic or bundled audio, transformed and drawn as a scrolling spectrogram with the waveform above and the analysis window as a bracket tying the two together, hover giving an exact time/frequency/dB/bin readout in tabular figures); the tradeoff as a control (window size and overlap live, as three named positions with the raw parameters folded into an advanced disclosure); four switchable window functions; three frequency scales (linear, log, mel); a synthesis mode that closes the round trip (build a signal, transform it, recover exactly what you put in); and a proof page. Six bundled samples are generated in code, so the app is a complete experience even with the microphone denied.
Built solo in one ~4-hour session — ~8,400 lines of source, a ~990-line DSP core, 256 tests running in ~5.6s, on three runtime dependencies and zero DSP, audio, or charting libraries. Measured on desktop at the reference load: ~0.105 ms per column, ~101× real time, ~0.6 bytes of heap growth per column over a minute — that last number is the one that matters. AnalyserNode is linked warmly as the faster native option; the claim here is correctness, not speed.
- 0
- 256
- ~101×
- 4
Have a project like this?
If you need a system built with the same care — clear scope, solid execution — let's talk.
Start a project