 AFM Studio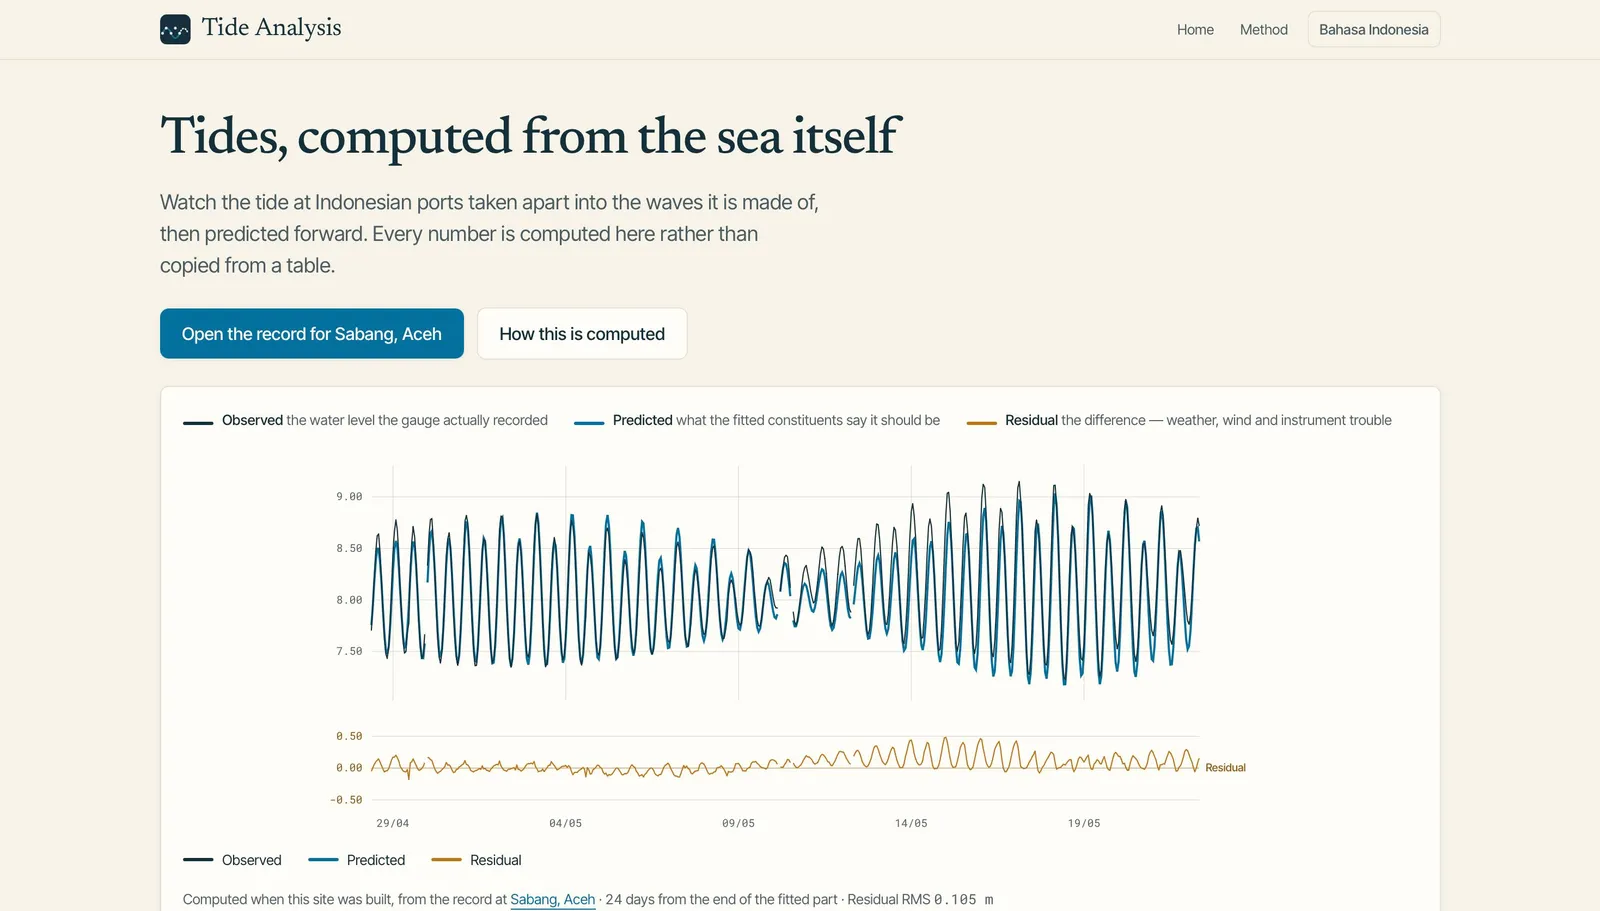

Tide Analysis
A site that watches the tide, does the math itself from raw sea-level readings, and tells you honestly when it doesn't have enough data to trust its own answer — instead of quoting numbers someone else calculated
Solo Developer
Aug 2026
On this page
The problem
Most tide-prediction tools work by looking up published harmonic constants — pre-calculated numbers describing how the Moon and Sun pull water at a given coastline — and summing them into a curve. That's fast, but it's a lookup: it proves nothing about whether the tool actually understands the physics, and it can't be adapted to a new, unpublished location.
This project instead starts from raw sea-level observations (real hourly readings from tide gauges) and derives those constants itself, in the browser, using the same least-squares curve-fitting oceanographers use. And that makes visible a problem lookup tools hide entirely: you need enough observation time to tell some tidal patterns apart. Two nearly-identical lunar/solar cycles (K1 and P1, or S2 and K2) can only be separated with roughly six months of data — ask a two-week record to separate them and any honest tool has to say "I can't," not guess. It is explicitly not for maritime navigation; Indonesia's official hydrographic office is named repeatedly as the authoritative source.
The approach
A pure computation core, so the numerical claims are testable
The astronomy (lib/astro, the Doodson argument calculator and nodal corrections) and the solver (lib/tide, least-squares fit, prediction, the classical Admiralty method) are plain functions over typed arrays — no React, no DOM, no clock, no network — which is what makes it possible to unit-test the actual numbers. The backbone is a synthetic generator written before the solver: generate a record from constants you chose, add noise you chose, then fit it and assert the recovered amplitudes match. When a synthetic test fails, the solver or the astronomy is wrong — never the tolerance.
Refuse rather than overfit, and report conditioning always
Before running a fit, the code checks whether the requested constituents are actually separable given the record's length (the Rayleigh criterion). If not, it returns a structured refusal naming which two conflict and how many days would resolve them — rather than fitting anyway and showing unstable, meaningless numbers, enforced by tests in both directions. Every solve returns its condition number as part of its result type, so no code path can silently drop the one signal that says whether the numbers mean anything. The residual — the gap between prediction and observation, where weather and storm surge live — is always drawn and never averaged away.
Honest data selection, learned the hard way
Sensor selection turned out to be non-trivial. A station can report several sensors against different zero points, and the most "complete" one can be a stuck gauge — one radar sensor at Benoa sat flat at −0.281 m for seven months while a working gauge beside it recorded real 2.3 m tides. Simple variance selection was fooled too: a Semarang sensor's 9-metre spikes gave it artificially high variance. The rule became "largest robust scale, reject spikes into declared gaps," and each finding is now an asserted test. A licence gate runs before the build — two of three data sources (UHSLC, BIG) are wired up but ship disabled, because their Indonesian-station attribution terms were never confirmed, and the build enforces that rather than a comment.
Results kept because they were surprising, not smoothed over
Gaps in a record aren't simply "bad": losing 70% of a record scattered across time barely hurts the fit, while losing the same 70% as one contiguous outage destroys it — kept as an explicit test rather than an anecdote. And a window-stability panel cuts each record into four stretches fitted separately to answer the question the app otherwise couldn't: whether a constant belongs to the harbour or just to these months (at Benoa, M2 moves 9% between stretches; S2 moves 56%). The constituent explorer deliberately re-sums already-fitted constants rather than refitting live — refitting was considered and rejected because a single strong constituent would silently absorb its neighbours and destroy the spring-neap lesson.
Outcome
Live and public, bilingual, fully static — all fitting and prediction runs client-side against pre-bundled JSON records, with two runtime dependencies and no tide, linear-algebra, or charting library (the astronomy, the solver, and the hand-built "marégraphe" chart are the project). It ships live in-browser harmonic fitting with the fitted curve over the observed trace and the residual band beneath; the Rayleigh slider — drag record length from 15 days to ~6 months and watch constituents go from resolved to unresolved as the condition number climbs; a least-squares-vs-Admiralty comparison; a constituent explorer where toggling M2 and S2 visibly produces the two-week spring/neap beat; a one-constituent derivation walked from timestamp to constant; and Formzahl tide-type classification across 8 real Indonesian ports spanning all four regimes — computed from each station's own fit, not quoted from a paper.
Built solo in a three-day build — ~12,500 lines of TypeScript, 377 tests across 24 files, 8 bundled IOC station records (212 days of hourly data each). It states prominently and repeatedly that it is educational, not for navigation, and shows every station's source, licence, record period, and datum.
- 377
- Refuses
- 8
- 0
Have a project like this?
If you need a system built with the same care — clear scope, solid execution — let's talk.
Start a project