 AFM Studio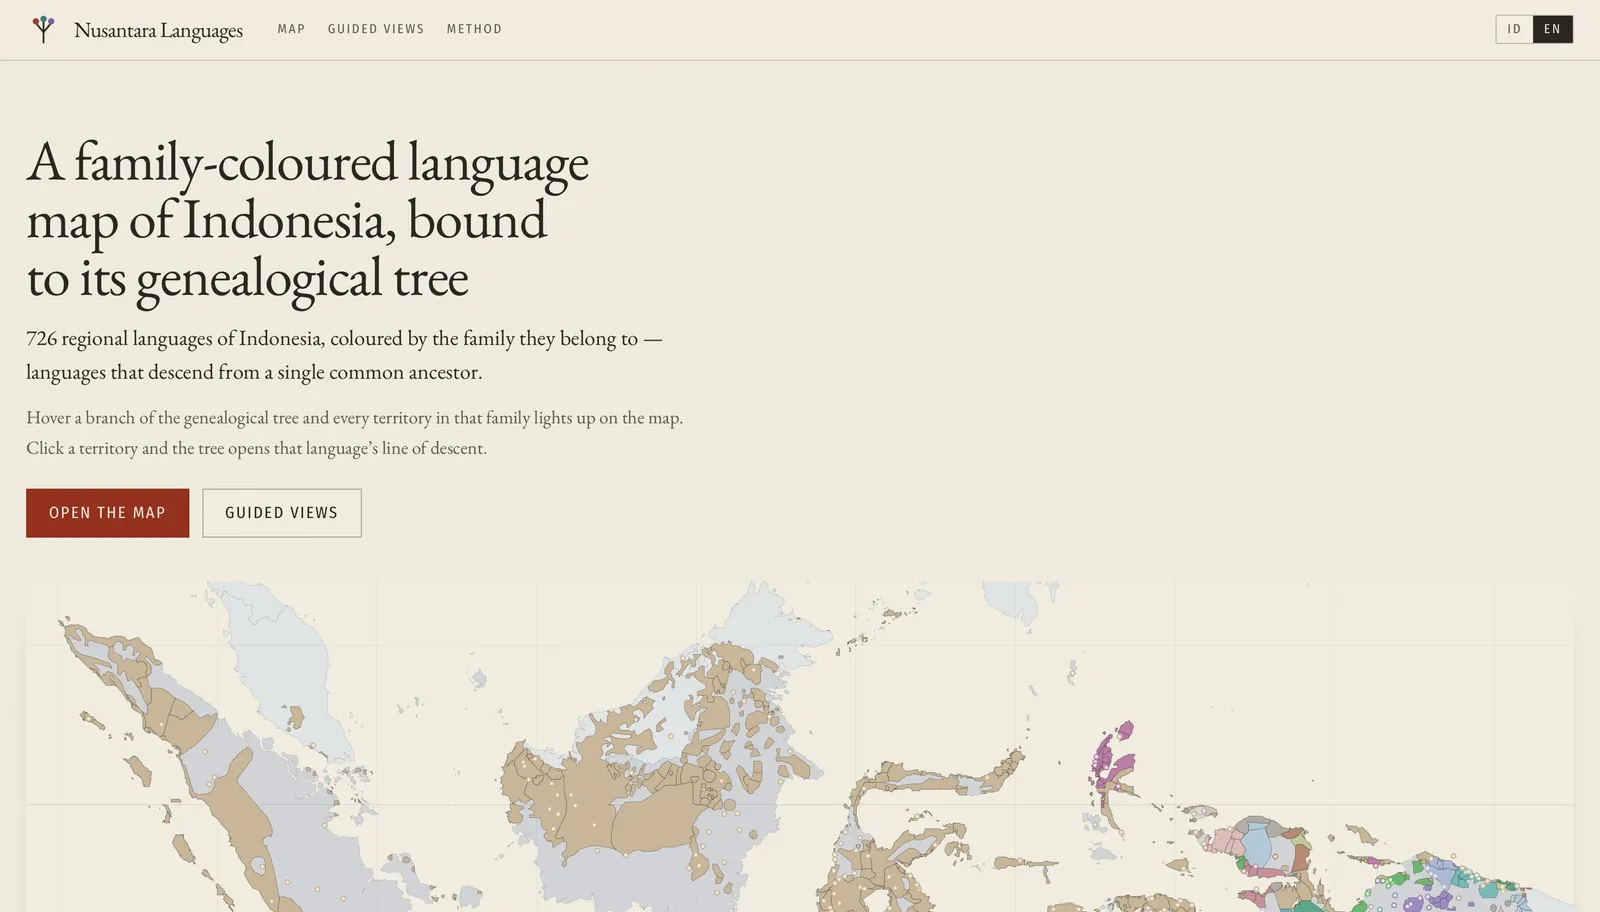
Nusantara Languages
An interactive map of Indonesia's 726 languages, coloured by family, with a genealogical tree wired to the map — hover a branch and every territory in that group lights up, and the other way around
Solo Developer
Aug 2026
On this page
The problem
Indonesia has one of the most linguistically dense territories on Earth — over 700 languages — but the structure of that diversity is essentially invisible to a general audience: which languages are related, and how the families spread across the archipelago. Language maps exist; family trees exist; nobody links the two into a single object you can explore. That's the gap — and it's a real, visible one, like the seam where the Austronesian and Papuan families meet, running straight through Halmahera.
It's a personal, open-source project, explicitly not the government's official "Peta Bahasa" — the resemblance would mislead, so it doesn't take that name or branding.
The approach
The linkage is the product
Map and genealogical tree are bound bidirectionally over one underlying data model: hover a branch of the tree and every matching territory saturates on the map; click a territory and the tree scrolls to it and expands its ancestry. These aren't two features kept in sync by hand — they're two read directions over the same structure. Everything genealogical (lib/tree) and geometric (lib/geo) is a pure function so the hardest logic — tree traversal, polygon simplification, hover hit-testing — is unit-testable in plain Node.
Built from scratch, static, and measured first
No mapping library with a tile dependency and no Newick parser — the tree parser and the SVG plate are the project. The whole dataset ships as a pre-built JSON bundle (a build-time pipeline fetches worldwide sources, filters to Indonesia, simplifies polygons, and emits the bundle with a coverage report; raw dumps are never committed), so there are zero runtime network requests. A render budget was measured at M0, before any styling — 19,570 vertices against a 60,000 budget, ~0.01 ms hover latency against 2 ms — so the simpler SVG path was kept rather than dropping to canvas.
A licence gate that blocks the build — and changed the map's era
The plan was to use Wurm & Hattori's 1980s atlas polygons — framed in the spec as "the thing that makes it beautiful." At the licence-gate stage that dataset turned out to be CC-BY-NC (non-commercial), legally incompatible with the CC-BY-SA the derived bundle is published under. Rather than quietly use it anyway, the project refused the source outright (recorded in the manifest as decision: 'refused', with the reason published on the method page) and substituted two CC-BY datasets — shifting the map's premise from "an early-1980s atlas" to "sources spanning 1990–2020." Ethnologue is banned categorically, including for tempting things like speaker counts, and a licence test asserts no Ethnologue-derived field exists in the shipped bundle: where a number is only available there, the field is omitted and the omission stated.
Points stay points, and colour carries meaning
Of 726 languages, 421 (58%) have mapped speaker-area polygons; the remaining 305 render as labelled points, visually distinguished rather than papered over with convex hulls — and the 58% figure is generated by the pipeline from the actual bundle, so it can't drift. The coastline is sourced from Natural Earth, never traced from the language areas (which would repeat the same "point inflated into a territory" error). Family colours are assigned stably from a curated OKLCH set scored against three colour-vision deficiencies — confusable pairs fell from 15 to 0 in normal vision — with saturation reserved for the current selection and endangerment shown as hatching, never a competing hue.
Outcome
Live and public, bilingual, fully static and offline. Beyond the core map↔tree binding, it reads that binding backwards three ways — nearest genealogical relatives on the map, how far a family's territory actually spans (Austronesian ~5,010 km; Timor-Alor-Pantar ~350 km), and which languages from different families physically touch (67 touching pairs across a segment-to-segment adjacency check) — and every one of those prints its rule and limit next to the number rather than hiding it in a tooltip. Plus a two-level colour reading (family vs. subgroup), guided views for seams like the Austronesian–Papuan contact, PNG export with attribution baked into the image (required by CC-BY-SA), and an accessibility pass that took the tree from 1,716 tab stops to one via a proper roving-tabindex role="tree".
Built solo in a compressed three-day build — ~15,100 lines of TS/TSX, 25 test files, on a deliberately minimal dependency list and no mapping, Newick, or topology library. It states plainly that boundaries between languages are gradients not lines, and how many languages have territories versus points.
- 726
- 58%
- 0
- Refused
Have a project like this?
If you need a system built with the same care — clear scope, solid execution — let's talk.
Start a project